Quick Facts about Washington State Adolescents
Introduction
WA PREP’s goal is to provide young people with complete and accurate information, knowledge, and skills so they can lead safe, productive and healthy lives. Below, are some health and wellness indicators for youth across Washington to contextualize why we do this work.
Map Instructions
- The red dots on the map show county level data for teen pregnancy, birth, chlamydia, and graduation rates. Click on a dot to learn more!
- Counties are ranked 1 to 39, where counties with the lowest rates for pregnancy, birth, and chlamydia are ranked as 1 and the highest rates are ranked as 39. For graduation rates, the highest graduation rate is ranked as 1 and the lowest is ranked as 39.
- You can also filter the map results to show top 10 counties for these indicators by using the dropdown menu below the map.*
- Explanation of data
Choose a county
Data goes here...
Adams County
1,909 adolescents aged 15-19
Teen Pregnancy rate
| 33 out of 1,000 |
27th out of 31 counties |
Teen Live Birth rate
| 23 out of 1,000 |
21st out of 27 counties |
Teen Chlamydia rate
| -- out of 100,000 |
-- out of 28 counties |
On-time Graduation rate
| 84% |
13th out of 38 counties |
Asotin County
1,147 adolescents aged 15-19
Teen Pregnancy rate
| 32 out of 1,000 |
26th out of 31 counties |
Teen Live Birth rate
| 24 out of 1,000 |
23rd out of 27 counties |
Teen Chlamydia rate
| 1,220 out of 100,000 |
15th out of 28 counties |
On-time Graduation rate
| 81% |
26th out of 38 counties |
Benton County
13,613 adolescents aged 15-19
Teen Pregnancy rate
| 26 out of 1,000 |
19th out of 31 counties |
Teen Live Birth rate
| 18 out of 1,000 |
17th out of 27 counties |
Teen Chlamydia rate
| 1,660 out of 100,000 |
23rd out of 28 counties |
On-time Graduation rate
| 83% |
14th out of 38 counties |
Chelan County
4,695 adolescents aged 15-19
Teen Pregnancy rate
| 28 out of 1,000 |
20th out of 31 counties |
Teen Live Birth rate
| 18 out of 1,000 |
18th out of 27 counties |
Teen Chlamydia rate
| 916 out of 100,000 |
5th out of 28 counties |
On-time Graduation rate
| 85% |
12th out of 38 counties |
Clallam County
3,489 adolescents aged 15-19
Teen Pregnancy rate
| 18 out of 1,000 |
10th out of 31 counties |
Teen Live Birth rate
| 12 out of 1,000 |
10th out of 27 counties |
Teen Chlamydia rate
| 1,089 out of 100,000 |
9th out of 28 counties |
On-time Graduation rate
| 57% |
38th out of 38 counties |
Clark County
31,239 adolescents aged 15-19
Teen Pregnancy rate
| 17 out of 1,000 |
9th out of 31 counties |
Teen Live Birth rate
| 11 out of 1,000 |
7th out of 27 counties |
Teen Chlamydia rate
| 1,489 out of 100,000 |
20th out of 28 counties |
On-time Graduation rate
| 85% |
11th out of 38 counties |
Columbia County
202 adolescents aged 15-19
Teen Pregnancy rate
| -- out of 1,000 |
-- out of 31 counties |
Teen Live Birth rate
| -- out of 1,000 |
-- out of 27 counties |
Teen Chlamydia rate
| -- out of 100,000 |
-- out of 28 counties |
On-time Graduation rate
| 64% |
37th out of 38 counties |
Cowlitz County
6,345 adolescents aged 15-19
Teen Pregnancy rate
| 22 out of 1,000 |
16th out of 31 counties |
Teen Live Birth rate
| 18 out of 1,000 |
16th out of 27 counties |
Teen Chlamydia rate
| 1,844 out of 100,000 |
25th out of 28 counties |
On-time Graduation rate
| 82% |
18th out of 38 counties |
Douglas County
2,856 adolescents aged 15-19
Teen Pregnancy rate
| 18 out of 1,000 |
12th out of 31 counties |
Teen Live Birth rate
| 14 out of 1,000 |
12th out of 27 counties |
Teen Chlamydia rate
| 1,506 out of 100,000 |
21st out of 28 counties |
On-time Graduation rate
| 89% |
4th out of 38 counties |
Ferry County
483 adolescents aged 15-19
Teen Pregnancy rate
| -- out of 1,000 |
-- out of 31 counties |
Teen Live Birth rate
| -- out of 1,000 |
-- out of 27 counties |
Teen Chlamydia rate
| -- out of 100,000 |
-- out of 28 counties |
On-time Graduation rate
| 66% |
36th out of 38 counties |
Franklin County
7,779 adolescents aged 15-19
Teen Pregnancy rate
| 30 out of 1,000 |
23rd out of 31 counties |
Teen Live Birth rate
| 23 out of 1,000 |
20th out of 27 counties |
Teen Chlamydia rate
| 2,185 out of 100,000 |
28th out of 28 counties |
On-time Graduation rate
| 80% |
28th out of 38 counties |
Garfield County
131 adolescents aged 15-19
Teen Pregnancy rate
| -- out of 1,000 |
-- out of 31 counties |
Teen Live Birth rate
| -- out of 1,000 |
-- out of 27 counties |
Teen Chlamydia rate
| -- out of 100,000 |
-- out of 28 counties |
On-time Graduation rate
| 89% |
5th out of 38 counties |
Grant County
7,442 adolescents aged 15-19
Teen Pregnancy rate
| 32 out of 1,000 |
25th out of 31 counties |
Teen Live Birth rate
| 24 out of 1,000 |
24th out of 27 counties |
Teen Chlamydia rate
| 1,008 out of 100,000 |
8th out of 28 counties |
On-time Graduation rate
| 76% |
32nd out of 38 counties |
Grays Harbor County
4,039 adolescents aged 15-19
Teen Pregnancy rate
| 23 out of 1,000 |
17th out of 31 counties |
Teen Live Birth rate
| 17 out of 1,000 |
15th out of 27 counties |
Teen Chlamydia rate
| 1,411 out of 100,000 |
18th out of 28 counties |
On-time Graduation rate
| 80% |
27th out of 38 counties |
Island County
3,478 adolescents aged 15-19
Teen Pregnancy rate
| 13 out of 1,000 |
6th out of 31 counties |
Teen Live Birth rate
| 8 out of 1,000 |
4th out of 27 counties |
Teen Chlamydia rate
| 1,121 out of 100,000 |
11th out of 28 counties |
On-time Graduation rate
| 86% |
8th out of 38 counties |
Jefferson County
1,133 adolescents aged 15-19
Teen Pregnancy rate
| -- out of 1,000 |
-- out of 31 counties |
Teen Live Birth rate
| -- out of 1,000 |
-- out of 27 counties |
Teen Chlamydia rate
| -- out of 100,000 |
-- out of 28 counties |
On-time Graduation rate
| 82% |
21st out of 38 counties |
King County
127,952 adolescents aged 15-19
Teen Pregnancy rate
| 12 out of 1,000 |
4th out of 31 counties |
Teen Live Birth rate
| 5 out of 1,000 |
2nd out of 27 counties |
Teen Chlamydia rate
| 123 out of 100,000 |
1st out of 28 counties |
On-time Graduation rate
| 86% |
7th out of 38 counties |
Kitsap County
14,091 adolescents aged 15-19
Teen Pregnancy rate
| 21 out of 1,000 |
13th out of 31 counties |
Teen Live Birth rate
| 13 out of 1,000 |
11th out of 27 counties |
Teen Chlamydia rate
| 1,639 out of 100,000 |
22nd out of 28 counties |
On-time Graduation rate
| 81% |
22nd out of 38 counties |
Kittitas County
4,720 adolescents aged 15-19
Teen Pregnancy rate
| 5 out of 1,000 |
2nd out of 31 counties |
Teen Live Birth rate
| -- out of 1,000 |
-- out of 27 counties |
Teen Chlamydia rate
| 975 out of 100,000 |
6th out of 28 counties |
On-time Graduation rate
| 85% |
10th out of 38 counties |
Klickitat County
1,212 adolescents aged 15-19
Teen Pregnancy rate
| -- out of 1,000 |
-- out of 31 counties |
Teen Live Birth rate
| -- out of 1,000 |
-- out of 27 counties |
Teen Chlamydia rate
| 1,320 out of 100,000 |
16th out of 28 counties |
On-time Graduation rate
| 87% |
6th out of 38 counties |
Lewis County
4,597 adolescents aged 15-19
Teen Pregnancy rate
| 29 out of 1,000 |
21st out of 31 counties |
Teen Live Birth rate
| 21 out of 1,000 |
19th out of 27 counties |
Teen Chlamydia rate
| 1,718 out of 100,000 |
24th out of 28 counties |
On-time Graduation rate
| 81% |
24th out of 38 counties |
Lincoln County
648 adolescents aged 15-19
Teen Pregnancy rate
| 30 out of 1,000 |
22nd out of 31 counties |
Teen Live Birth rate
| -- out of 1,000 |
-- out of 27 counties |
Teen Chlamydia rate
| -- out of 100,000 |
-- out of 28 counties |
On-time Graduation rate
| 91% |
1st out of 38 counties |
Mason County
3,415 adolescents aged 15-19
Teen Pregnancy rate
| 37 out of 1,000 |
31st out of 31 counties |
Teen Live Birth rate
| 30 out of 1,000 |
27th out of 27 counties |
Teen Chlamydia rate
| 732 out of 100,000 |
3rd out of 28 counties |
On-time Graduation rate
| 73% |
34th out of 38 counties |
Okanogan County
2,382 adolescents aged 15-19
Teen Pregnancy rate
| 32 out of 1,000 |
24th out of 31 counties |
Teen Live Birth rate
| 26 out of 1,000 |
25th out of 27 counties |
Teen Chlamydia rate
| 1,134 out of 100,000 |
12th out of 28 counties |
On-time Graduation rate
| 85% |
9th out of 38 counties |
Pacific County
1,029 adolescents aged 15-19
Teen Pregnancy rate
| 35 out of 1,000 |
28th out of 31 counties |
Teen Live Birth rate
| 23 out of 1,000 |
22nd out of 27 counties |
Teen Chlamydia rate
| -- out of 100,000 |
-- out of 28 counties |
On-time Graduation rate
| 66% |
35th out of 38 counties |
Pend Oreille County
695 adolescents aged 15-19
Teen Pregnancy rate
| 36 out of 1,000 |
30th out of 31 counties |
Teen Live Birth rate
| -- out of 1,000 |
-- out of 27 counties |
Teen Chlamydia rate
| -- out of 100,000 |
-- out of 28 counties |
On-time Graduation rate
| 91% |
2nd out of 38 counties |
Pierce County
53,368 adolescents aged 15-19
Teen Pregnancy rate
| 22 out of 1,000 |
15th out of 31 counties |
Teen Live Birth rate
| 12 out of 1,000 |
8th out of 27 counties |
Teen Chlamydia rate
| 2,136 out of 100,000 |
27th out of 28 counties |
On-time Graduation rate
| 82% |
17th out of 38 counties |
San Juan County
665 adolescents aged 15-19
Teen Pregnancy rate
| -- out of 1,000 |
-- out of 31 counties |
Teen Live Birth rate
| -- out of 1,000 |
-- out of 27 counties |
Teen Chlamydia rate
| -- out of 100,000 |
-- out of 28 counties |
On-time Graduation rate
| 78% |
30th out of 38 counties |
Skagit County
7,441 adolescents aged 15-19
Teen Pregnancy rate
| 26 out of 1,000 |
18th out of 31 counties |
Teen Live Birth rate
| 16 out of 1,000 |
13th out of 27 counties |
Teen Chlamydia rate
| 1,411 out of 100,000 |
19th out of 28 counties |
On-time Graduation rate
| 81% |
23rd out of 38 counties |
Skamania County
631 adolescents aged 15-19
Teen Pregnancy rate
| -- out of 1,000 |
-- out of 31 counties |
Teen Live Birth rate
| -- out of 1,000 |
-- out of 27 counties |
Teen Chlamydia rate
| -- out of 100,000 |
-- out of 28 counties |
On-time Graduation rate
| 83% |
15th out of 38 counties |
Snohomish County
46,608 adolescents aged 15-19
Teen Pregnancy rate
| 15 out of 1,000 |
7th out of 31 counties |
Teen Live Birth rate
| 7 out of 1,000 |
3rd out of 27 counties |
Teen Chlamydia rate
| 1,163 out of 100,000 |
13th out of 28 counties |
On-time Graduation rate
| 82% |
20th out of 38 counties |
Spokane County
37,727 adolescents aged 15-19
Teen Pregnancy rate
| 15 out of 1,000 |
8th out of 31 counties |
Teen Live Birth rate
| 11 out of 1,000 |
6th out of 27 counties |
Teen Chlamydia rate
| 1,360 out of 100,000 |
17th out of 28 counties |
On-time Graduation rate
| 83% |
16th out of 38 counties |
Stevens County
2,582 adolescents aged 15-19
Teen Pregnancy rate
| 13 out of 1,000 |
5th out of 31 counties |
Teen Live Birth rate
| 10 out of 1,000 |
5th out of 27 counties |
Teen Chlamydia rate
| 697 out of 100,000 |
2nd out of 28 counties |
On-time Graduation rate
| 73% |
33rd out of 38 counties |
Thurston County
18,107 adolescents aged 15-19
Teen Pregnancy rate
| 18 out of 1,000 |
11th out of 31 counties |
Teen Live Birth rate
| 12 out of 1,000 |
9th out of 27 counties |
Teen Chlamydia rate
| 1,215 out of 100,000 |
14th out of 28 counties |
On-time Graduation rate
| 81% |
25th out of 38 counties |
Wahkiakum County
185 adolescents aged 15-19
Teen Pregnancy rate
| -- out of 1,000 |
-- out of 31 counties |
Teen Live Birth rate
| -- out of 1,000 |
-- out of 27 counties |
Teen Chlamydia rate
| -- out of 100,000 |
-- out of 28 counties |
On-time Graduation rate
| -- |
-- out of 38 counties |
Walla Walla County
4,914 adolescents aged 15-19
Teen Pregnancy rate
| 22 out of 1,000 |
14th out of 31 counties |
Teen Live Birth rate
| 16 out of 1,000 |
14th out of 27 counties |
Teen Chlamydia rate
| 1,099 out of 100,000 |
10th out of 28 counties |
On-time Graduation rate
| 80% |
29th out of 38 counties |
Whatcom County
17,128 adolescents aged 15-19
Teen Pregnancy rate
| 9 out of 1,000 |
3rd out of 31 counties |
Teen Live Birth rate
| 5 out of 1,000 |
1st out of 27 counties |
Teen Chlamydia rate
| 893 out of 100,000 |
4th out of 28 counties |
On-time Graduation rate
| 82% |
19th out of 38 counties |
Whitman County
8,249 adolescents aged 15-19
Teen Pregnancy rate
| 3 out of 1,000 |
1st out of 31 counties |
Teen Live Birth rate
| -- out of 1,000 |
-- out of 27 counties |
Teen Chlamydia rate
| 994 out of 100,000 |
7th out of 28 counties |
On-time Graduation rate
| 90% |
3rd out of 38 counties |
Yakima County
19,683 adolescents aged 15-19
Teen Pregnancy rate
| 35 out of 1,000 |
29th out of 31 counties |
Teen Live Birth rate
| 28 out of 1,000 |
26th out of 27 counties |
Teen Chlamydia rate
| 1,981 out of 100,000 |
26th out of 28 counties |
On-time Graduation rate
| 78% |
31st out of 38 counties |
*Counties with too little data will not show up in the top ten lists or have county specific data displayed to protect privacy and ensure accuracy.
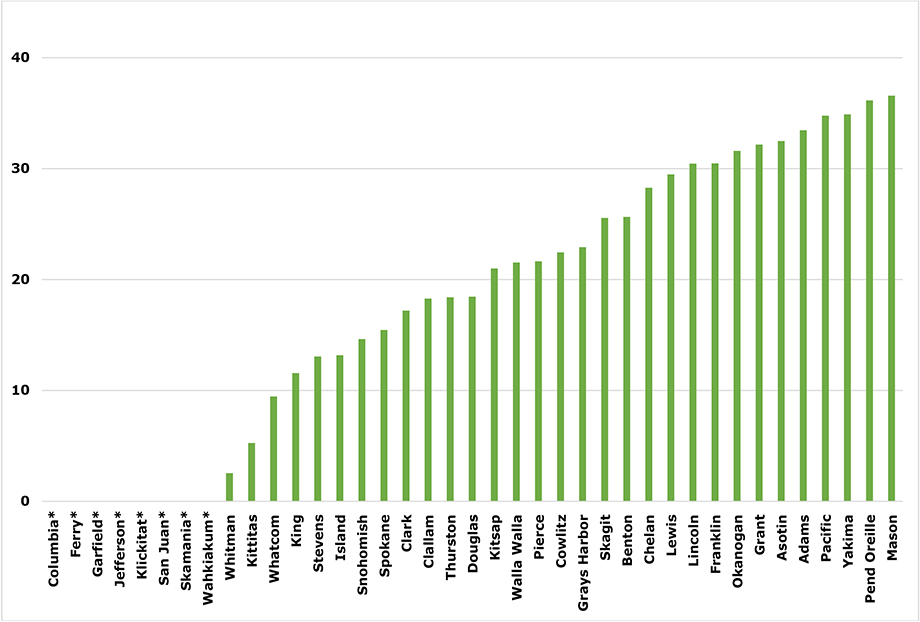
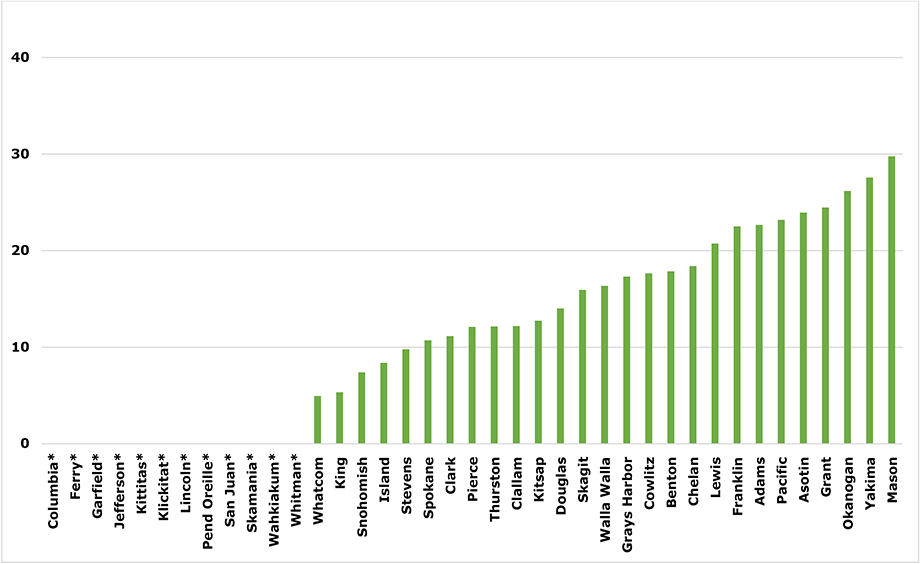
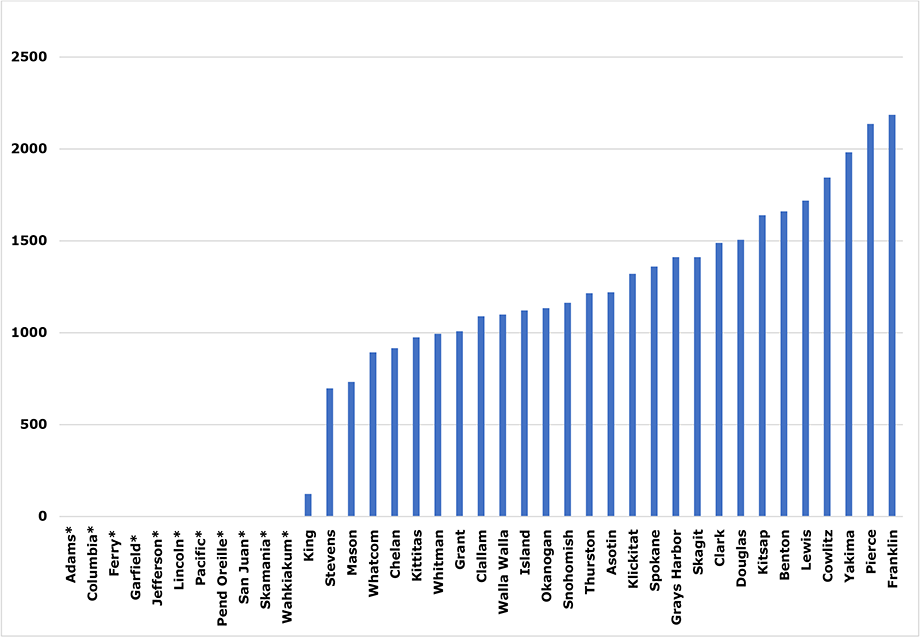
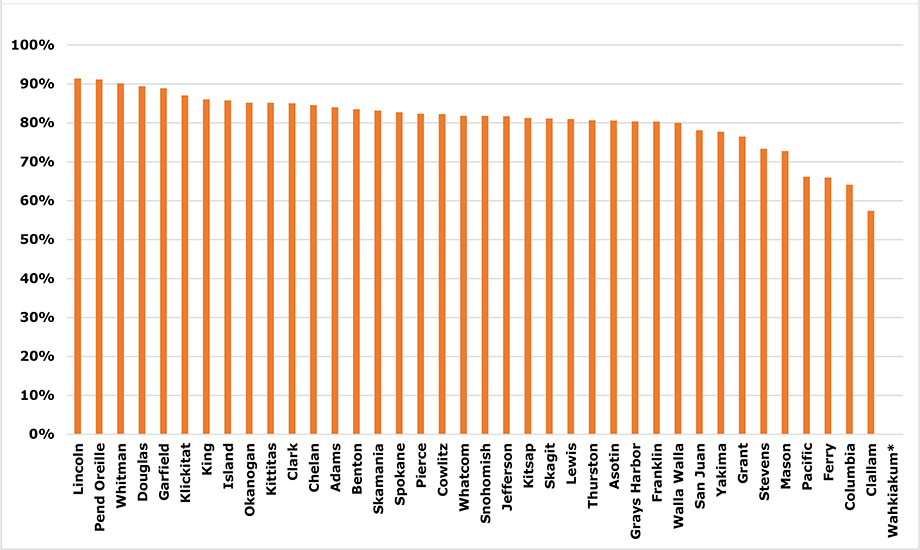
The following graphs show teen pregnancy, teen birth, chlamydia, and graduation rates for counties in Washington State. Counties without bar lines have too little data to share.
2020 Pregnancy Rates in WA per 1,000, Ages 15-19

*Data suppressed
2020 Live Birth Rates in WA per 1,000, Ages 15-19

*Data suppressed
2020 Chlamydia Rates in WA per 100,000, Ages 15-19

*Data suppressed
2021 Graduation Rates in WA by County

*Data suppressed
Why are we presenting this information?
We chose the age range (15-19 years old) since it most closely matches the ages for high school students (14-18 years old). Although the primary focus of PREP is to help young people make informed decisions about pregnancy and safe sex[1], we believe that through comprehensive sex education, WA PREP is supporting youth in developing healthy relationships, preventing partner violence, increasing caregiver child communication and creating safe and inclusive environments across Washington.
Sources & References
Footnotes
1Family & Youth Services Bureau. (2020, October 1). State Personal Responsibility Education Program. State Personal Responsibility Education Program. Retrieved April 27, 2022, from https://www.acf.hhs.gov/sites/default/files/documents/fysb/fysb_app_stateprep_factsheet_oc_2020_508.pdf
Pregnancy Rates
Washington State Department of Health, Center for Health Statistics, Abortion Reporting System-Report of Induced Termination of Pregnancy, 1990-2020, Community Health Assessment Tool (CHAT), December 2021.
Birth Rates
Washington State Department of Health, Center for Health Statistics Birth Certificate Data, 1990-2020, Community Health Assessment Tool (CHAT), November 2021.
Chlamydia Data
Washington State Department of Health, Infectious Disease, STD Services Section, PHIMS-STD, 1992-2020, Community Health Assessment Tool (CHAT), April 2022.
Graduation Rates
State of Washington. Office of Superintendent of Public Instruction. Report Card Graduation 2020-2021. https://data.wa.gov/education/Report-Card-Graduation-2020-21/rrud-rd4u. Accessed April 22, 2022.
